NICHD Serial Analysis of Gene Expression (SAGE) Data
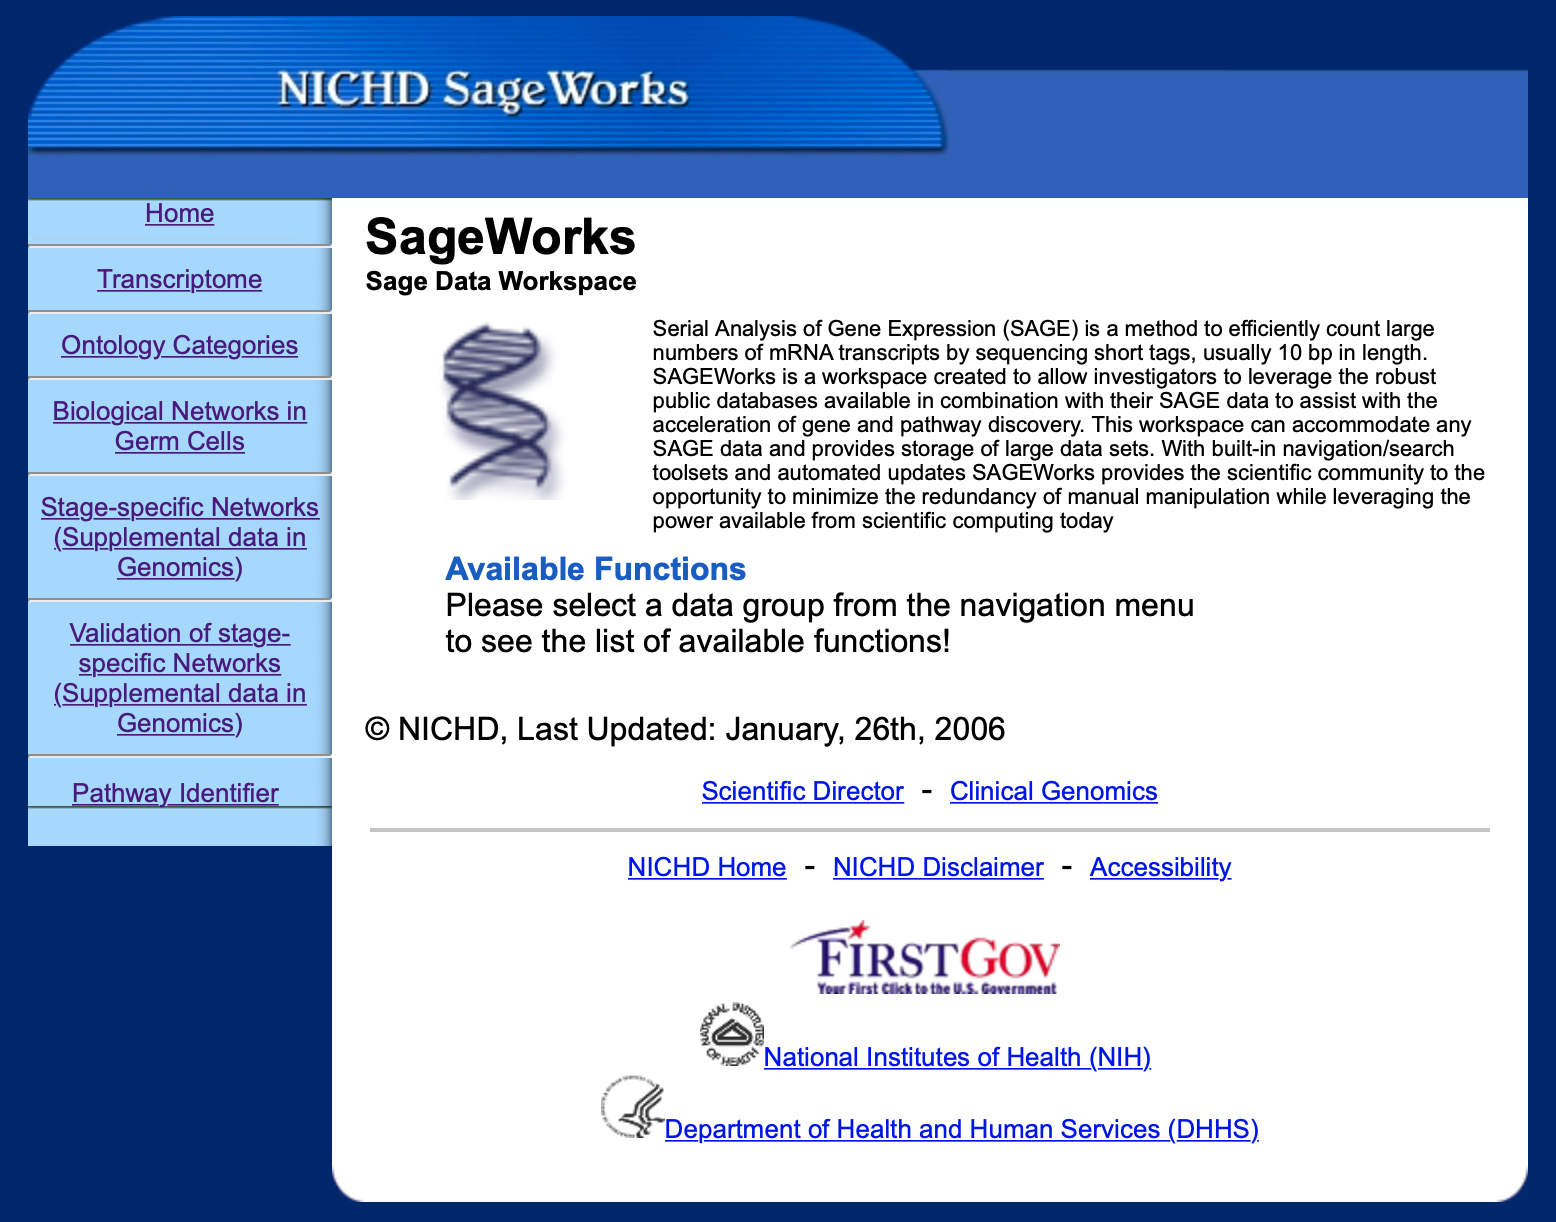
Serial Analysis of Gene Expression (SAGE) is a method to efficiently count large numbers of mRNA transcripts by sequencing short tags, usually 10 bp in length. These workspaces can accommodate any SAGE data and provides storage of large data sets.
These sites have been archived. For access to a particular data set, please contact Loc Vu.

SAGEWorks is a workspace created to allow investigators to leverage the robust public databases available in combination with their SAGE data to assist with the acceleration of gene and pathway discovery. With built-in navigation/search toolsets and automated updates SAGEWorks provides the scientific community to the opportunity to minimize the redundancy of manual manipulation while leveraging the power available from scientific computing today.
For access to SageWorks data, please contact Loc Vu.

GermSAGE is a collection of male germ cell transcriptiome information derived from Serial Analysis of Gene Expression (SAGE). It includes the three key germ cell stages in spermatogenesis, including mouse type A spermatogonia (Spga), pachytene spermatocytes (Spcy), and round spermatids (Sptd). A total of 452,095 SAGE tags are represented in all the libraries and is by far the most comprehensive resource available.
For access to GermSAGE data, please contact Loc Vu.

GonadSAGE is a collection of male embryonic gonad transcriptome information derived from Serial Analysis of Gene Expression (SAGE). A total of six male mouse embryonic gonad stages were included in the current version (E10.5, E11.5, E12.5, E13.5, E15.5 and E17.5). The sequence coverage for each SAGE library is above 150K. A total of 908,453 SAGE tags are represented in all the libraries and is by far the most comprehensive resource available.
For access to GonadSAGE data, please contact Loc Vu.

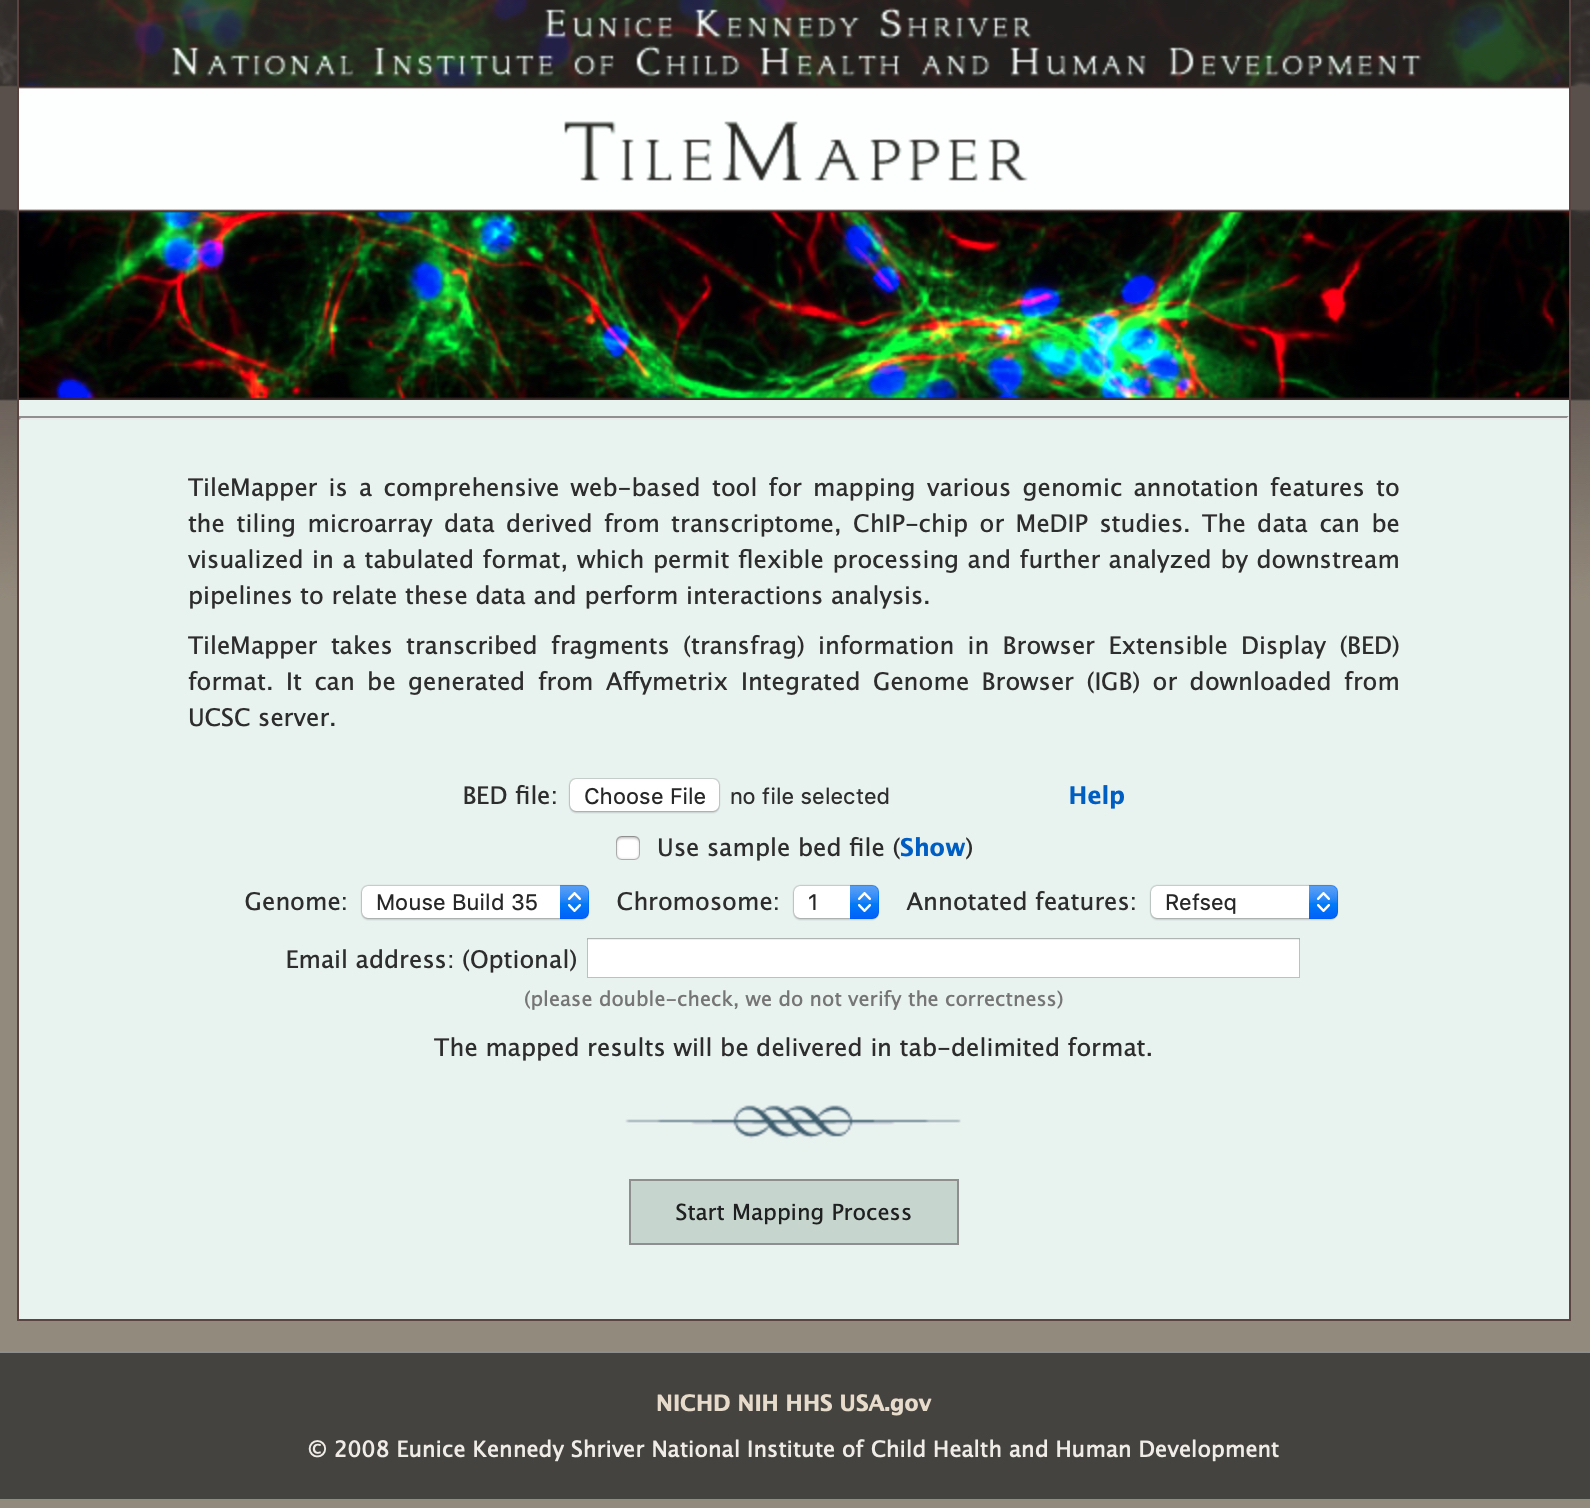
TileMapper is a comprehensive web-based tool for mapping various genomic annotation features to the tiling microarray data derived from transcriptome, ChIP-chip or MeDIP studies. The data can be visualized in a tabulated format, which permit flexible processing and further analyzed by downstream pipelines to relate these data and perform interactions analysis.
TileMapper takes transcribed fragments (transfrag) information in Browser Extensible Display (BED) format. It can be generated from Affymetrix Integrated Genome Browser (IGB) or downloaded from UCSC server.
For access to TileMapper data, please contact Loc Vu.
